US English (US)
FR French
DE German
ES Spanish
IT Italian
PL Polish
BR Portuguese (Brazil)

Contact Us

If you still have questions or prefer to get help directly from an agent, please submit a request.
We’ll get back to you as soon as possible.

Please fill out the contact form below and we will reply as soon as possible.

  • Contact Us
  • Submit a Diagnostic Report
English (US)
US English (US)
FR French
DE German
ES Spanish
IT Italian
PL Polish
BR Portuguese (Brazil)
  • Home
  • Troubleshooting

Capturing your Browser Logs

Written by TJ Salyars

Updated at November 13th, 2023

Contact Us

If you still have questions or prefer to get help directly from an agent, please submit a request.
We’ll get back to you as soon as possible.

Please fill out the contact form below and we will reply as soon as possible.

  • Getting Started for Advisors
  • Getting Started for Managers
  • Ticket Functionality
    Basic Ticket Functionality Advanced Ticket Functionality
  • Contact Management
  • Insights
  • Manage Team Settings
    Team Settings VoiceHub Settings Chat Settings EmailHub Settings WhatsApp
  • Manage Company Settings
  • Admin Page Settings
  • Integrations
  • Mobile App Functionality
  • Best Practices
  • Troubleshooting
  • FAQ's
+ More

Table of Contents

Steps to capture browser logs

For certain troubleshooting scenarios, the customer success team may request you capture and share your browser logs.

Steps to capture browser logs

  1. Visit the website where you are experiencing the error.
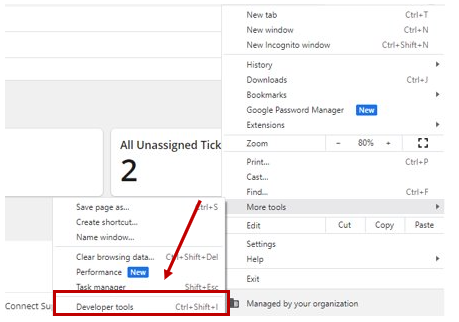
  2. In the top-right corner of the browser, click the three-dot ellipsis menu (⋮).
  3. Select More Tools > Developer Tools. The Developer Tools window will open as a docked panel on the side or bottom of your browser. 
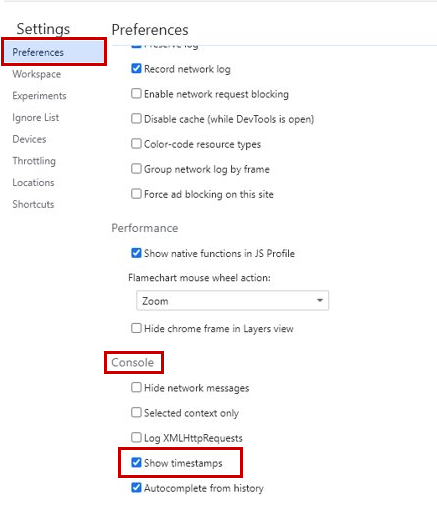
  1. Click the gear icon on the top right.
  2. Scroll down to Console and click the check box to enable timestamps.
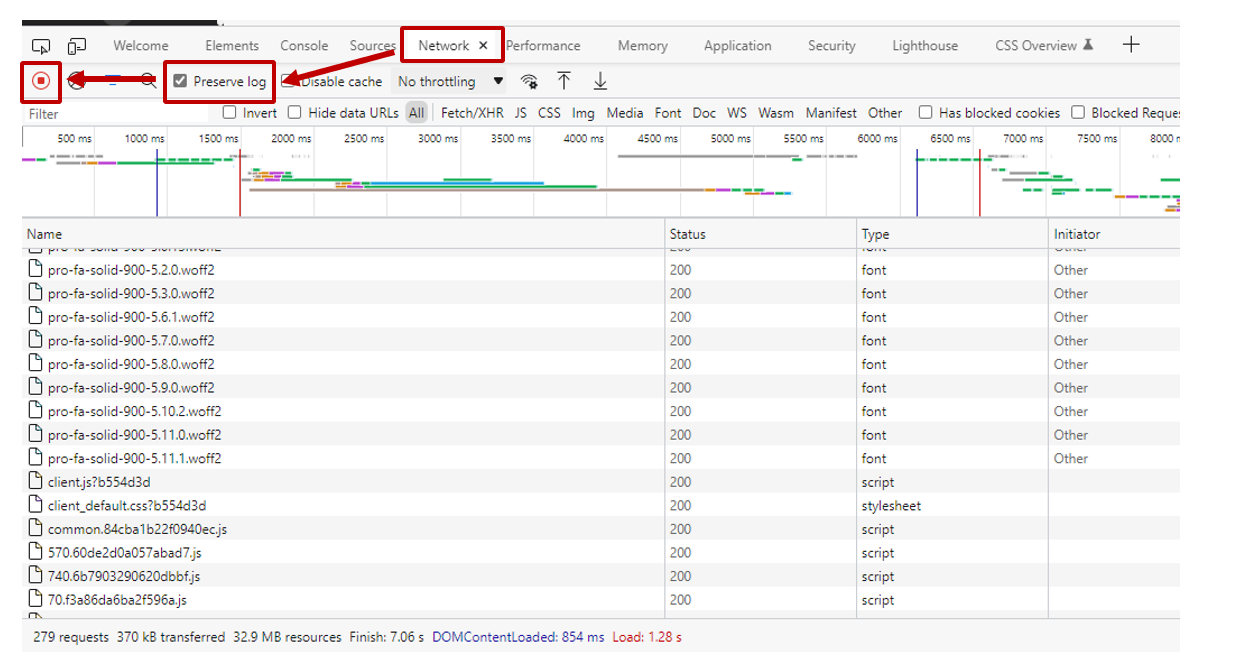
  1. Click out of settings and click the Network tab.
  2. Click Preserve log.
  3. You will see a red recording circle in the top-left corner of the panel. This means the capture has started. If the circle is black, click the black circle to start recording activity in your browser.
  4. Refresh the page and reproduce the issue while the logs are recording.
  5. After you successfully reproduced the issue, right click on any row of the activity row and click Save all as HAR with Content.
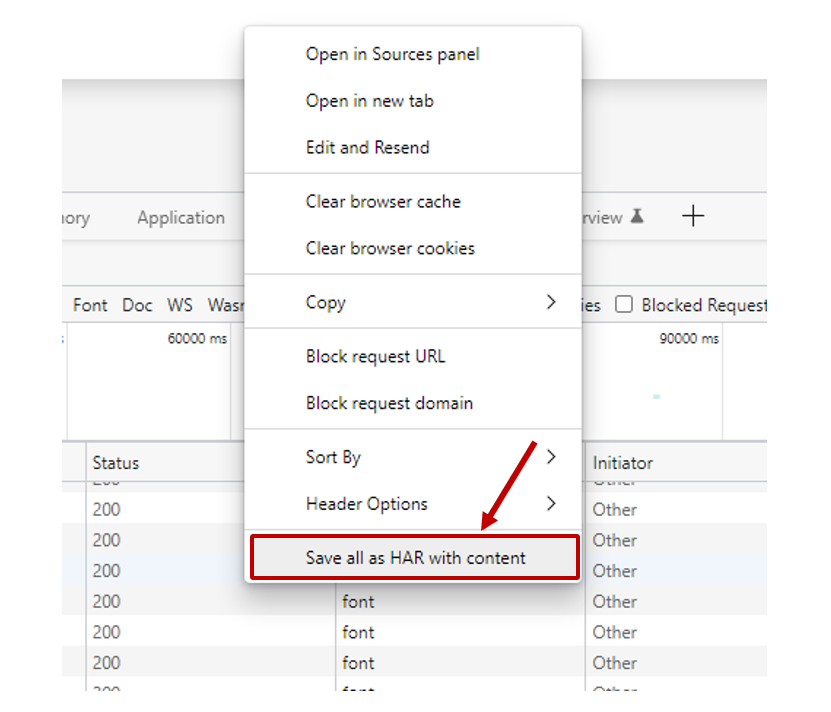
  6. Save the HAR file to your device.
  7. Click into the Console tab.
  8. Right-click anywhere in the console and select "Save as...".
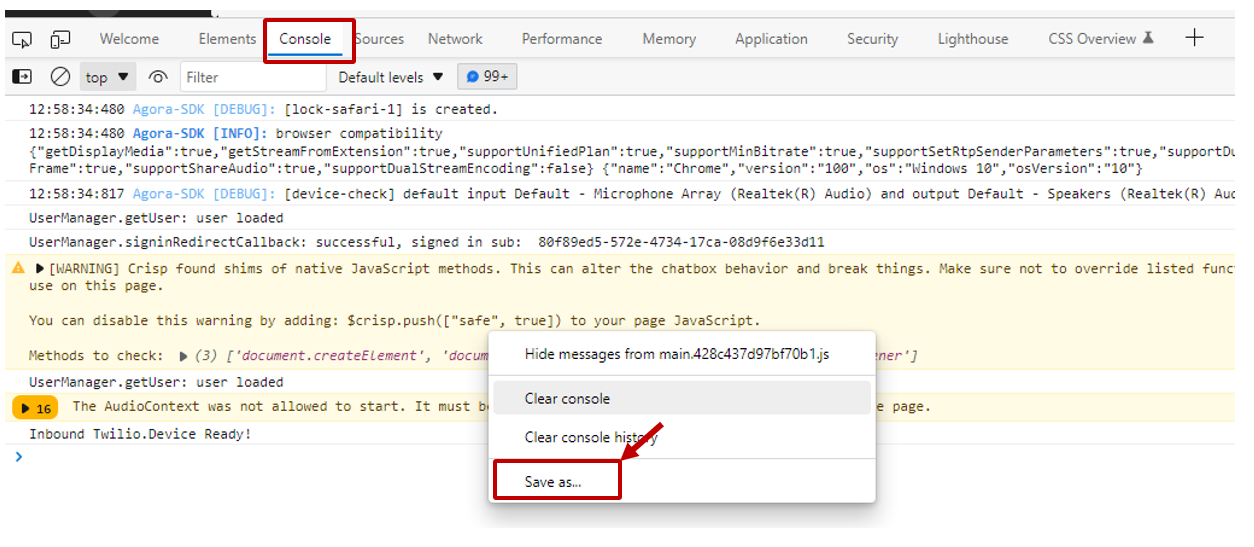
  9. Name the log file console-log.txt.
  10. Attach the file and send to expertconnect@johndeere.com.
capture browser logs

Was this article helpful?

Yes
No
Give feedback about this article

Related Articles

  • Marketing Toolkit - Resources and Ideas
  • Create and Manage Teams
  • Merge Tickets
Feedback

United States
  • Terms and Conditions

Content is protected by copyright. Copying, modifying, or reposting content is prohibited. Copyright © 2023 Deere & Company. All Rights Reserved


Knowledge Base Software powered by Helpjuice

Expand