refreInsights is an interactive data visualization tool inside the ExpertConnect web dashboard that allows managers to better understand tracked activities in ExpertConnect and make more informed business decisions.
Insights is available via the web dashboard for those manager-level access in a dealership's account. Use the filters along the right-hand panel to filter data.

Insights helps you track:
- Ticket volume over time
- Time to first response / time to resolution
- Average ratings
- Advisor & team activity
- Top ticket tags
- Most active customers
- And more!
If you'd like to share live insights updates on a screen at your dealership, we recommend using the Easy Auto Refresh extension to automatically refresh your insights data at a faster rate.
- The Insights dashboard refreshes Monday through Friday at 2AM US Central Time.
Metric Calculations
Time to First Response - From the moment a ticket is created to when an advisor responds. Time to first response is recorded when an action is taken on a ticket from the dealership side, including a voice or video call placed in the ticket, when a manual timer is started on the ticket, when a message is sent from the advisor to the customer, or when the ticket is re-assigned.
- Answered phone calls have an immediate response (0 seconds)
- Customer makes a ticket via web and an advisor takes 5 minutes to read over the ticket and initial chat and then replies to the customer (5 minutes)
- In the overall calculation of this metric, all tickets with a first response value (open/closed/archived) are considered (including tickets with an immediate response)
Time to Resolution - From the moment a ticket is created to the moment the advisor closes the ticket
- Ticket must be marked as Closed as we use the delta between the created timestamp and the closed timestamp to calculate the metric
- At this time, off-hours and weekends are part of the calculation (regardless of the ring schedule set)
Median and Mean - Calculated the same way for both sets of ticket data as defined above
- For the Median, we take all the values and the middle value is displayed
- For the Mean, we take all the values and the average value is displayed
Downloading Data
If you're wanting to pull charts from a specific section, like ticket tags, VoiceHub calls, or ticket count, you can download an Excel report of that data set.
- Hover over the chart.
- Click the three-dot elipsis.
- Click Export Data.
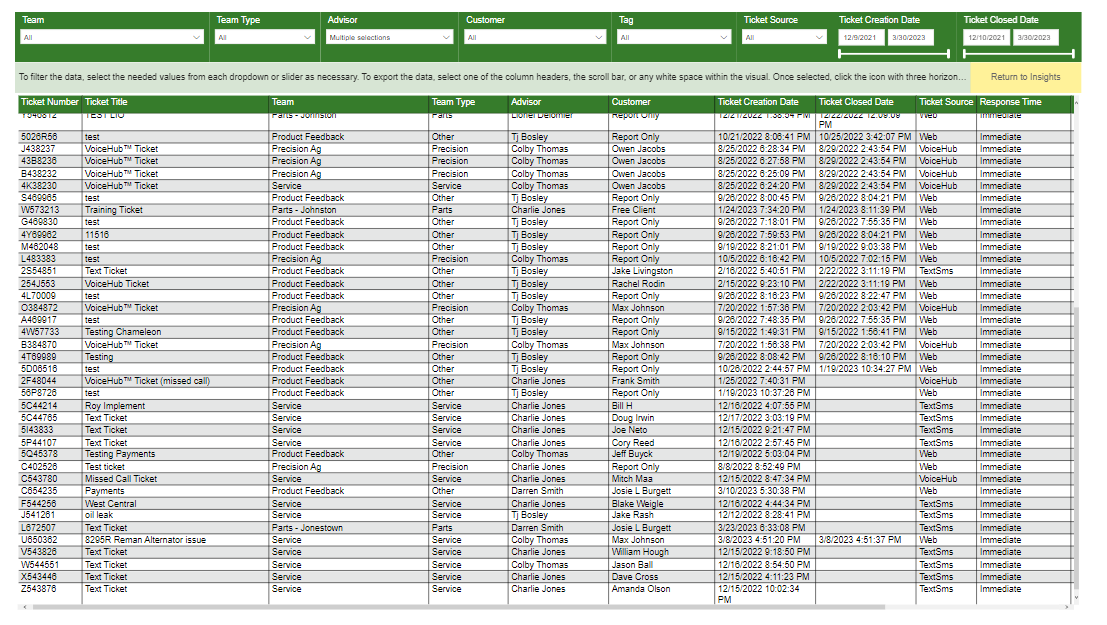
To pull an export of several data points, including specific advisor, customer, and ticket response time information, select the yellow “View Export Table” in the top right corner. Once you've applied the filters for the data you need, hover of the top right of the insights view, select the three ellipsis, and click “Export Data.” See more on how to pull data in this video.

Technical Communicator Dashboard
Advisors who are on a team with a Technical Communicator team type have access to a TC dashboard on the Insights tab. This page can be navigated to view TC Metrics, CCMS and EC, COG Metrics, Technician Details, TC Not Well Prepared Details, and Tech Not Well Prepared Details.
Users on a Technical Communicator team who have an Advisor level role will only have access to the TC Dashboard page on Insights and not the overall company Insights Dashboard metrics shared above.

To ensure data is showing for your dealership, have all advisors on the Technical Communicator team complete the following:
- The users are set up in a role that can create and manage tickets (Primary, Manager, Advisor).
- The users are assigned to a team with the Technical Communicator team type (only tickets within this team type will show on the dashboard).
- The user's X-ID must be in their User Profile.
- The users name must match in ExpertConnect and CCMS.
JDE Insights
JDE Insights provides a comprehensive view of your John Deere Experience (JDE) metrics within the ExpertConnect™ platform. Easily access and analyze key data to enhance customer support.
- Anonymous Surveys: Only numerical responses are available. Identifiable responses are removed.
- Update Cadence: Data updates daily (see image) and defaults to a month over month view. Users can change the date range using the slider on the calendar timeline (see image).
- Survey Comments: Repeated PINs equal multiple comments—not duplicate surveys.
Summary Tab
- Dealer Experience by Survey Type
- Dealer Experience by Store
- Top Comment Themes
Comment Insights
- Store Feedback Sources
- Product Feedback Sources
- Top Comment Themes
- Survey Comments
Closed Loop (TBD)
- Open Alerts
- Alerts 2+ Weeks Old
- Generation Trends
- Comment Themes
- Current Alert Status
- Alert Details
Resources/Translations
- Resources: Access the John Deere Experience Platform, website, FAQ, and surveys.
- Translations: Any section or field not translated within the dashboard will be shown here.
Check out the John Deere Experience channel to learn more!!!
